Candidates: Are you interviewing and need support?
When we think of workforce planning, we tend to think of our organization as existing in a vacuum.
“How many hourly employees will we need next year?”
“Will engineering headcount increase or decrease?”
“What do we expect turnover to be at the management level?”
These are very important questions, and they deserve consideration. But there’s another, equally important, part of the workforce planning equation: evaluating external talent supply.
External talent supply describes the market of available talent for the roles you need to fill.
You’re probably not tracking this yet.
Understanding the talent marketplace is crucial for both budgeting and developing recruiting strategy. You need to understand how your internal talent demands compare to the external talent supply.
When Should I Evaluate the External Talent Market?
Generally speaking, you should look at the market of external talent at the same time you conduct workforce planning.
Some job roles are also a better natural fit for analysis. Since market analysis plays a key role in directing your recruiting efforts and making them more effective, focus on roles that take up a large percentage of your time and budget.
Good fits for analysis are:
- Roles you hire at a high volume. Any changes you make to how you recruit these roles will have a large overall impact.
- Roles that take a disproportionate amount of budget to hire. Like with high volume roles, any changes you make here will yield out sized results.
- Roles that are exactly the same across geographies (e.g. remote workers). Analyzing this talent market is significantly easier, since it is less necessary to dig into state and local data.
In this blog, you’ll learn how to analyze the market of available talent for a specific job role. We’ll illustrate with a mock analysis of the talent market for customer service representatives in financial services.
1) Establish the Available Talent Market
Most jobs have close analogues. When analyzing the available talent market for a particular role, it’s important to keep these in mind. The available talent market for a given role is the number of people who could realistically fill the job. An available talent market should include:
- The role you’re analyzing, in your industry;
- The role you’re analyzing, in other industries;
- Roles similar to the role you’re analyzing.
In the US, the Bureau of Labor Statistics (BLS) has already identified similar jobs for you in their Occupational Outlook Handbook. Since we’re looking at customer service representatives, we can go to that role’s page:
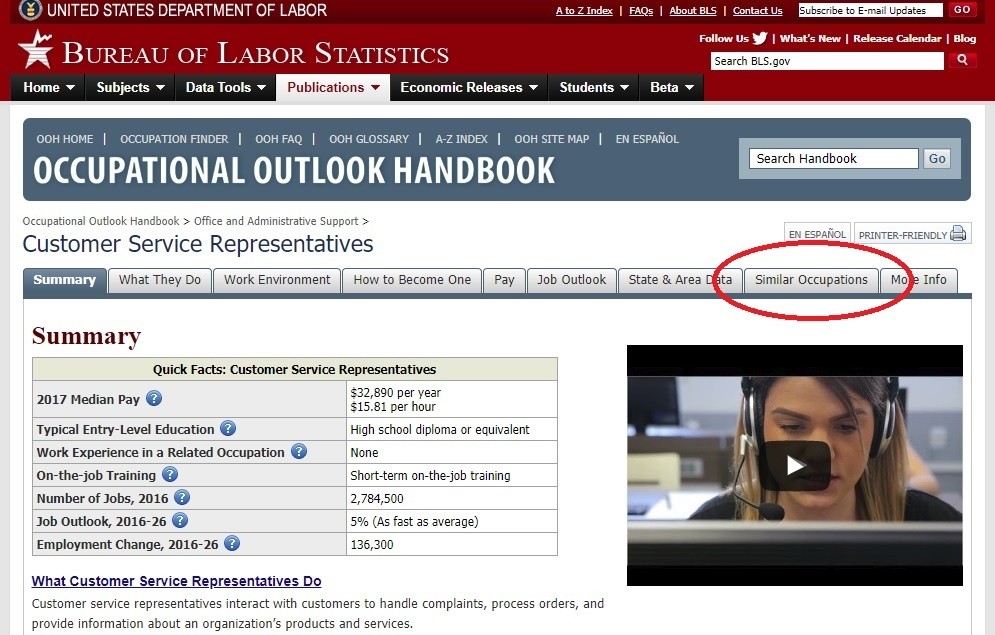
From here you’ll want to go to the “Similar Occupations” tab.
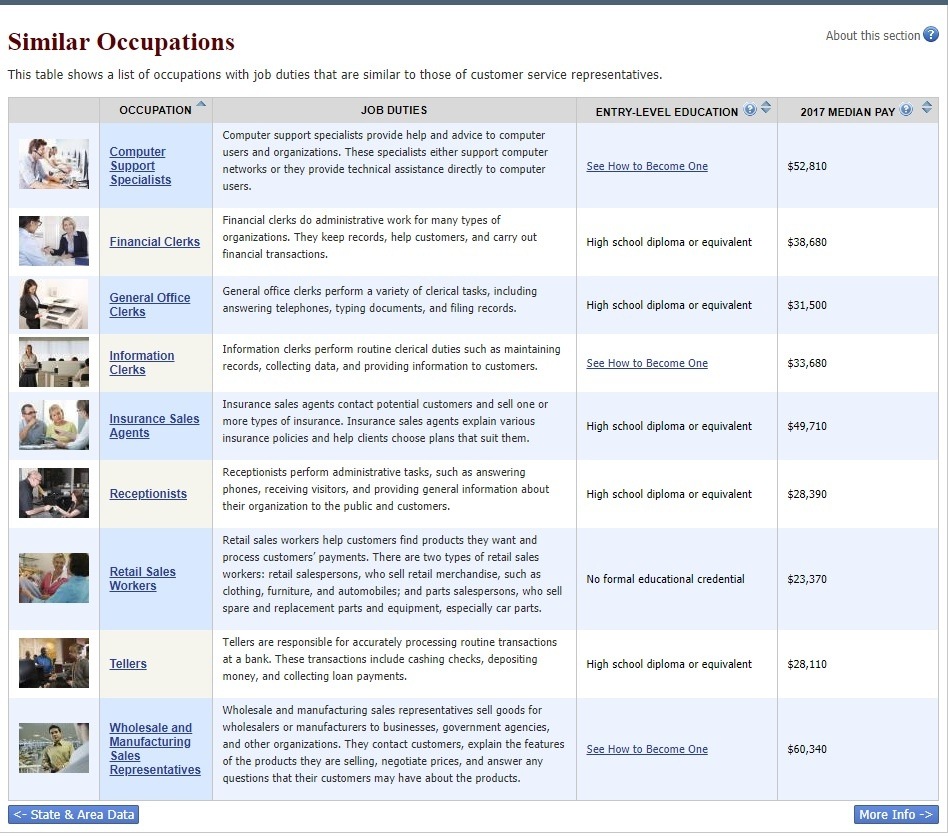
From these we can pick out those in similar pay brackets:
We should also include customer service representatives from other industries in our analysis. Clicking on the “Work Environment” tab yields other major industries that employ customer service representatives.
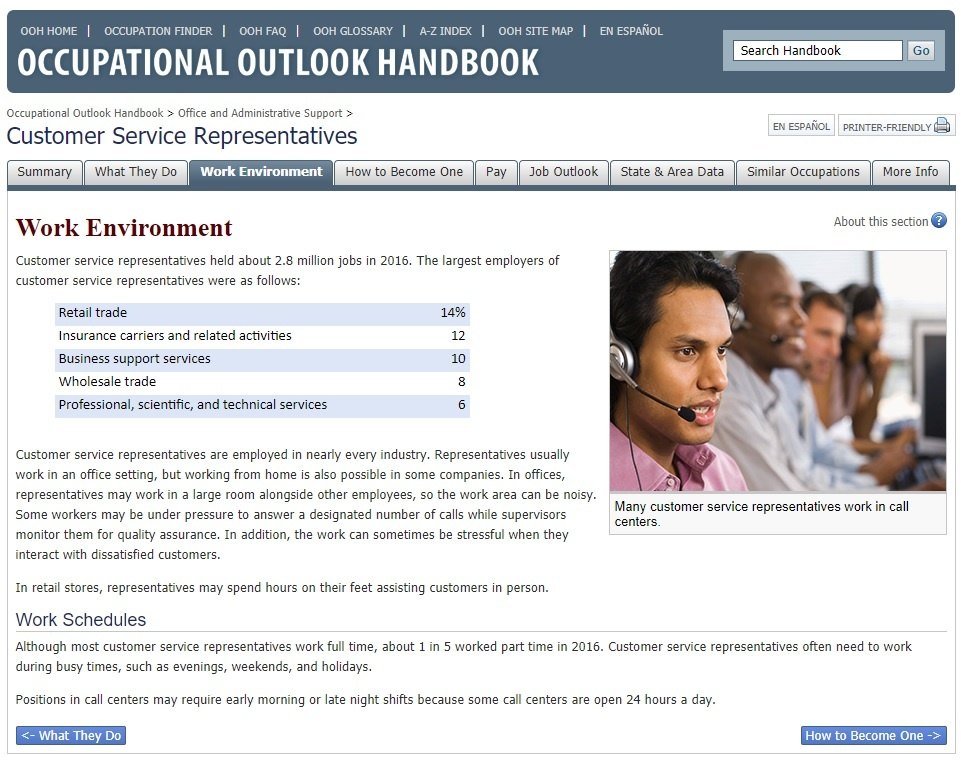
Including the two main subsections of financial service, banking and insurance, we get a available talent market that looks like this:
- Banking (called Credit Intermediation by the BLS) Customer Support Representatives
- Insurance Customer Support Representatives
- Retail Customer Support Representatives
- Business Support (these are outsourced support providers) Customer Support Representatives
- Wholesale Customer Support Representatives
- Financial Clerks
- General Office Clerks
- Bank Tellers
2) Gather Relevant Data
After establishing the available talent market, you need to look at the employment numbers and job outlook for each role in the market. Here we’ll focus on performing an analysis of the US market with publicly available data.
Total Employment & Outlook for Customer Service Representatives
We can find the aggregate numbers for customer service representatives (or any other major job role) on the Employment by Detailed Occupation page from the BLS.

This page also displays the expected growth of each role over a 10 year period.
- Total Employment of Customer Service Representatives: 2,784,500
- Job Outlook (10 year): 5%
Nationwide Employment & Outlook for Customer Service Representatives and Similar Jobs
The BLS also provides details about a role’s employment and outlook by industry. To get this data, we need to go to the “Job Outlook” tab in the Occupational Outlook Handbook.
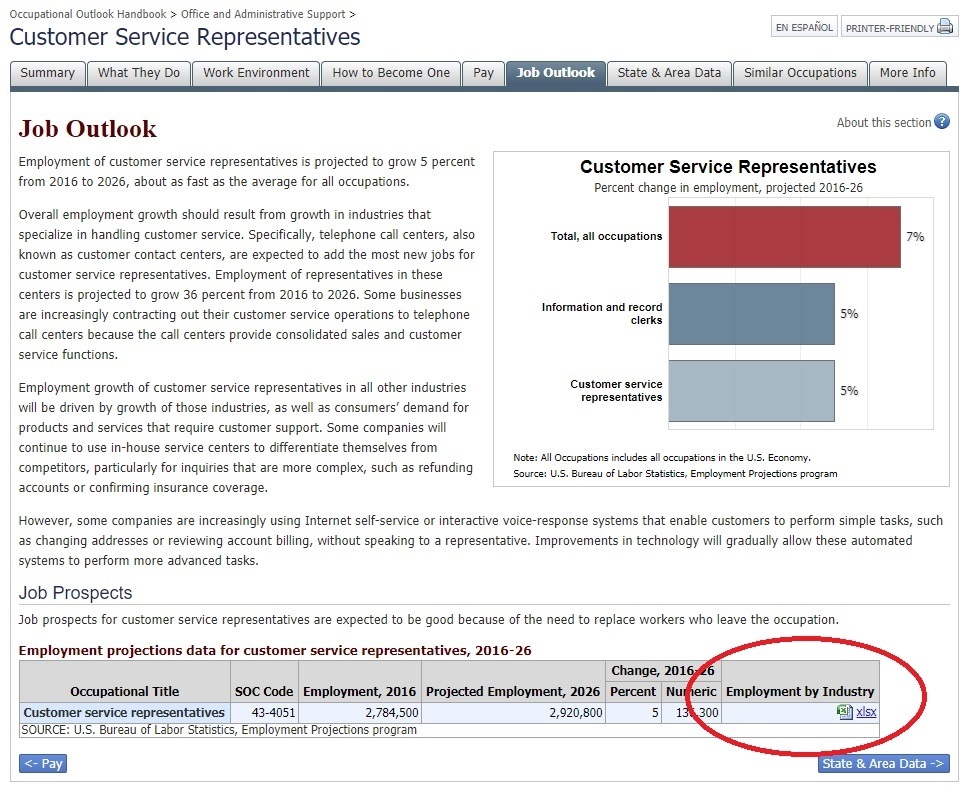
We want to download the spreadsheet linked at the very bottom of this page.
In this spreadsheet, we can find the appropriate data for each type of customer support representative we’ve identified in our available talent market.
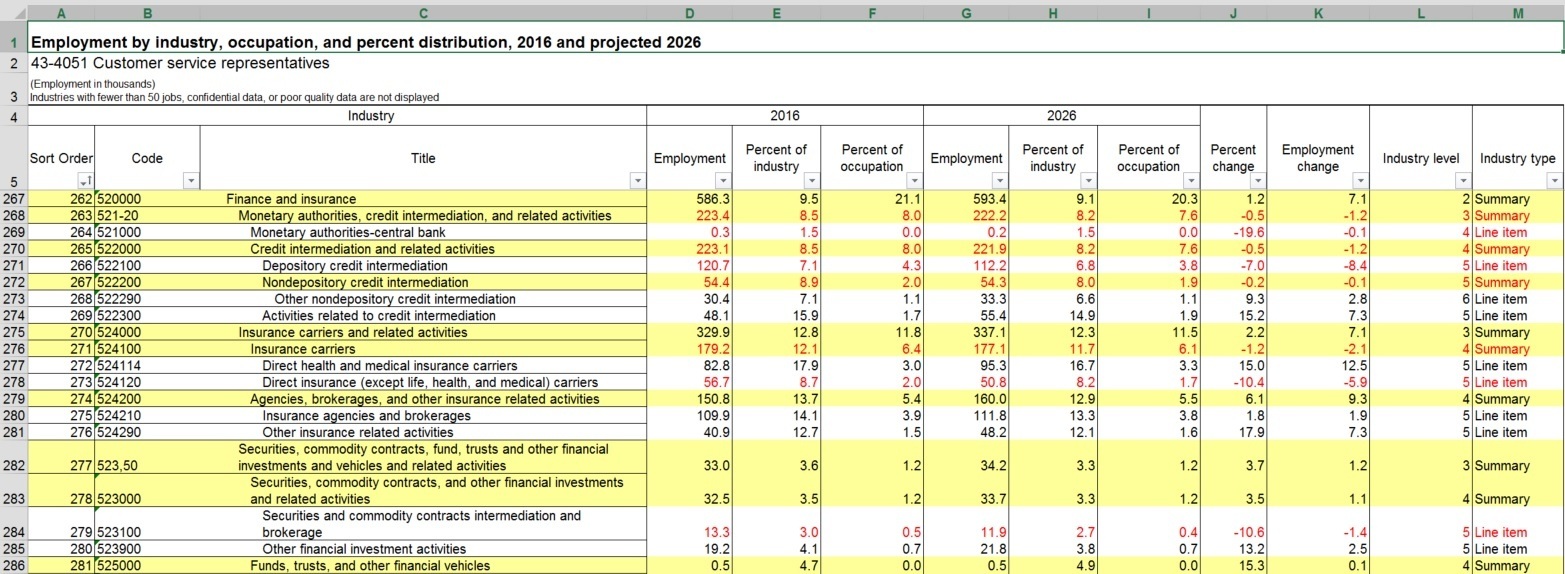
- Total Employment in Financial Services: 586,000
- Job Outlook (10 year): 1.2%
- Credit Intermediation (Banking): 223,000
- Job Outlook (10 year): -0.5%
- Insurance Carriers: 329,900
- Job Outlook (10 year): 2.2%
- Retail: 381,500
- Job Outlook (10 year): 5.3%
- Business Support: 284,500
- Job Outlook (10 year): 30.2%
- Wholesale: 212,400
- Job Outlook (10 year): -3.7%
For the similar occupations in our available talent market, we can go to their respective pages in the Occupational Outlook Handbook.
- Financial Clerks: 1,440,400
- Job Outlook (10 year): 9%
- General Office Clerks: 3,117,700
- Job Outlook (10 year): -1%
- Bank Tellers: 502,700
- Job Outlook (10 year): -8%
You can get even more granular by slicing up these similar occupations by industry (just like we did for the customer service role). For example, when we look at Financial Clerks, we see that 17% are employed in healthcare and social assistance.
Employment & Outlook by State and Metropolitan Area
National hiring trends often do not reflect trends at the state and local level. There are a couple resources you can use to dig into job roles by state and metropolitan area.
The first is in the Occupational Outlook Handbook. Go to the role’s “State & Area Data” tab, and click the link with the job’s title.
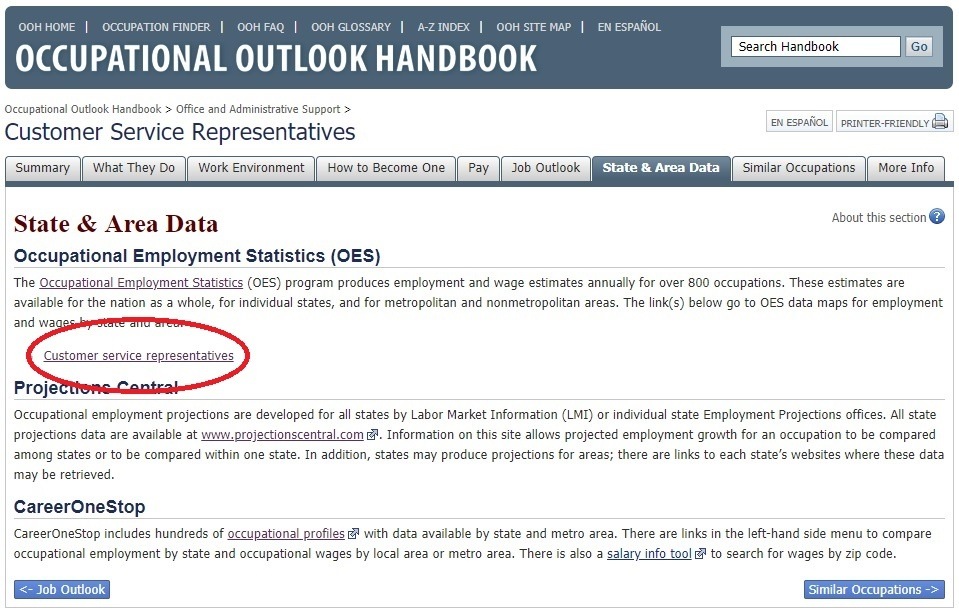
On this page you can access a series of maps that provide employment and wage data by state or metropolitan area.
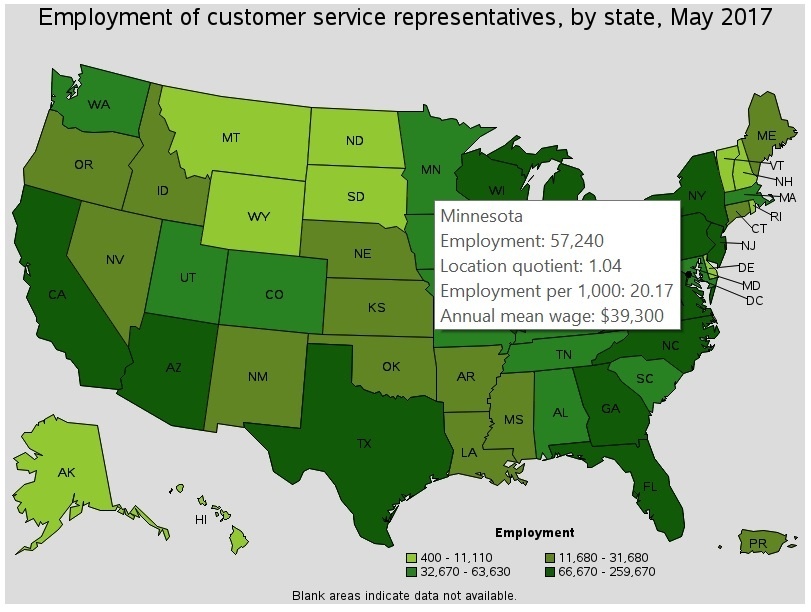
Minnesota employs 57,240 customer service representatives at an average annual wage of $39,300.

Most of these (44,270) are employed in the Minneapolis-St. Paul-Bloomington area at an average wage of $40,270. Careeronestop provides this information by state or city, as well as projected employment growth by state. For example, when we look at customer service representatives in Denver, CO, we see the median annual wage is around $36,500.
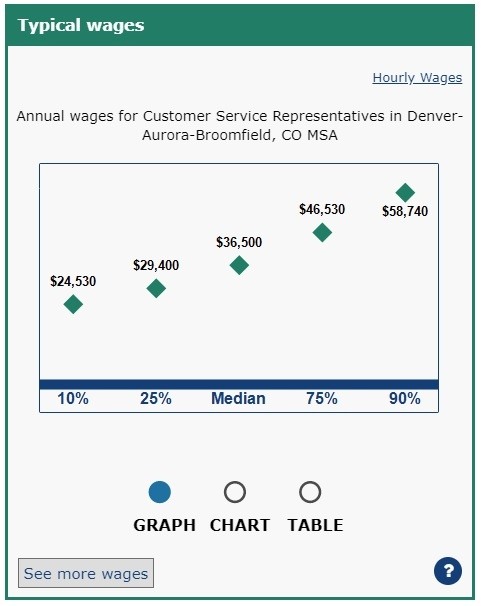
We can also see that customer service representative jobs are expected to grow in Colorado by 27% over 10 years.

- Customer Service Representative, Colorado: 47,170
- Job Outlook, Colorado (10 year): 27%
This state and local data is particularly useful for designing competitive payment packages. It is also invaluable for identifying high-growth, high-competition areas that will need more attention.
3) Identify Opportunities
Recruiting opportunities should become apparent as you look at the data. A key takeaway from the analysis should be which areas of the talent market to pursue and which to avoid.
Talent Pools to Pursue
You should pursue pockets of talent with low competition and high ROI. Talent pools that fit this requirement generally have one or both of these traits:
- Negative projected growth. Jobs with negative projected growth are an excellent source of talent. Employees in these roles will likely be looking for work anyway, and competition with employers will be low.
- High relative employment. More potential applicants means greater ROI for any strategy you implement to target them.
In the case of the customer service representative, bank tellers fit both of these criteria. Teller jobs are expected to decline by 8% over the next 10 years, and there are more than 500,000 tellers in the US. Armed with this data, you might:
- Design recruitment marketing campaigns aimed at current tellers.
- Revisit your applicant database and look for previous applicants with teller experience, then target them with specific messaging.
- Design internal mobility programs to transition some of the tellers you have (for organizations employing both tellers and customer service representatives).
- Create an employment branding plan, with a heavy emphasis on testimonials from former tellers.
- Revise career maps to include past teller experience.
- Make job descriptions inclusive of past teller experience.
- Use state and local data to evaluate your payment packages.
Talent Pools to Avoid (or at least put less effort into)
You should also avoid pockets of talent with high competition and low ROI. This means avoiding jobs that have:
- High projected growth. Recruiting from talent pools with high projected growth is competitive. You don’t want to compete with industries on a hiring spree. For example, the Business Support industry is projected to increase their customer service hires by 30.2% over the next 10 years. Organizations in Business Support will compete heavily for each other’s talent. Why engage in a talent war when there are other areas hiring less competitively?
- Low relative employment. You only have so many resources to target a specific group of potential employees. To get the most from your efforts, you should avoid small groups. For example, the Mining industry employs only 200 customer service representatives in the US. Why target them when you can develop a strategy for employees in the Retail industry, which employs more than 300,000?
When you have this data on hand, it's also much easier to sell new recruiting initiatives. While you might just confirm your existing hunches, the data makes your case more convincing to skeptical stakeholders.
Once you conduct a market analysis, how do you differentiate your organization from the competition?

