Candidates: Are you interviewing and need support?
In a recent episode of his podcast Work Life, the renowned organizational psychologist Adam Grant said it best, “Data don't talk. They can't answer your questions, they can only inform your questions.” I want to show you how your HireVue data can be used to inform the right questions in order to optimize your hiring process. Because you shouldn’t have to be a BI analyst, data scientist or mathematician to inform your recruiting strategy with data.
Here at HireVue, we don’t believe in data for data sake - we believe data should be actionable. With a lot of great numbers in the HireVue product, your ability to make data-driven decisions is limitless. I’m here to help you know where to look in order to focus and make informed choices about your process, even if data is not your day job.
Improve processes and save time using pre-built charts

Every instance of HireVue comes with pre-built reports intended to make life easier for your team. Lean into these time saving tools to uncover opportunities for improvement for both your candidates and hiring managers.
Questions to ask or tips to improve by metric:
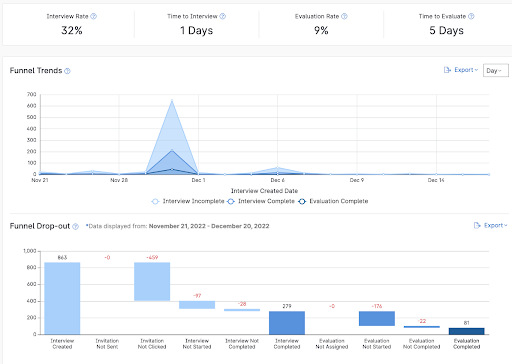
- Invitation not clicked: Ignored invites could be something as simple as re-writing a subject line. Or maybe it’s improved communication with candidates about what to look for from the company.
- Interview not completed: There’s a fine balance between collecting the right data and making the process too cumbersome – steep candidate dropoff could signal the need to reduce steps or streamline the process.
- Evaluation not completed: If your hiring managers are taking a while to complete evaluations that means candidates are hearing radio silence. This number could help you determine that you need to put in a status update text message on day three instead of waiting for final evals.
- Funnel trends: In the funnel trend chart, are there regular busy hiring months/weeks you need to be prepared for and have resources ready?
Get the most out of evaluations

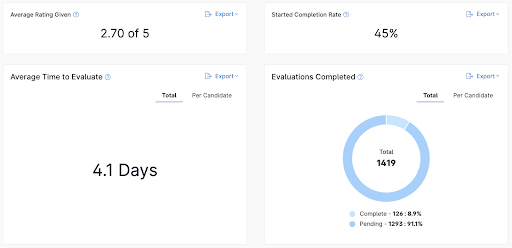
When considering evaluations, there are a few metrics to look at to improve efficiency in your hiring process. The first and most important is to create benchmarks using the average rating of candidates. If your average candidate is receiving low stars, this could suggest unqualified people are being invited to the interview step and something needs to change near the top of the funnel. And if you suddenly get a candidate who scores a five when your average rating is a 3 – you may have found a rockstar that needs expediting.
Also, if you see that evaluations are being started but not completed, work with your team to ensure they submit their ratings.
Sometimes there’s nothing that can be done to improve a metric itself. For instance, in the example above it’s taking 4 days from interview completion to evaluation. Perhaps that’s with the team working full steam and you can’t get that number down with current headcount. It’s okay to be honest, but then imagine you’re a candidate who’s eager for a new role and you don’t hear anything back for 96 excruciating hours. Perhaps it’s time to fill in the gap with a text reminder or WhatsApp message 48 hours after completion?
Bring the analysis inside with exports
Maybe you have questions that aren’t easily answered in the pre-built reports? The possibilities for insights are vast with the data available, so let’s dig into exports. Each export gives you a table of raw data that can be downloaded and analyzed. Let’s walk through a hypothetical question and how you could approach answering it.
Question: Is our CodeVue challenge a good level of difficulty and a reliable indicator of knowledge for this position?
Step one: collaborate with your hiring manager
Answering questions using data is often a collaborative effort. One of the best places to start is with the people making the final decision. Find out if there’s a particular indicator that would indicate without a doubt that a candidate is suited for the job – is that available in the raw data? If so, start taking a look
Step two: how to export
Since we’re curious about our CodeVue data, we’ll download the CodeVue Challenge Scores export. As an admin, go to the Analytics tab along the top of the platform. Choose Data Exports along the options on the left and navigate to CodeVue Challenge Scores Export.
Choose the following filters:
- Date Filter: If it’s a busy position, you may only want a sample from the past month or so, or you can set a custom range for as long as the position’s been active.
- Team: This question assumes we’re looking at a specific CodeVue challenge, so narrow down the export by choosing the team that has the position of interest.
Step three: analyze a subset
Open the downloaded file and filter the export by the columns Position Title or Challenge Title, to look at a specific subset of the data. Compute an average Percentage Score by performing an Average command on that column (eg. AVERAGE(Y2:Y60)). This number tells you the typical passing score of all of the candidates in the sample. If it’s 10%, that means very few are passing and the challenge is likely difficult; if it’s 90% then most tests are being passed. You may also compute counts of those that passed at various levels (eg. COUNTIF(Y2:Y60,”>0.5”) would count how many candidates scored over 50%). This result shows how many candidates are passing most of the tests.
Based on the results, using either of these methods can help you determine if your coding challenge should be changed.
Step four: use the data, then go beyond it
If there is an ongoing issue with candidate quality, it may be time to look closer at who you’ve successfully hired. Look up those employees’ scores from Exports of when they were candidates and compare to any performance metrics on the job, to see if the CodeVue challenge is an indicator of on-the-job performance. If they had a high CodeVue challenge, do they also perform well on the job?
Using data to improve the performance of your recruiting team doesn’t have to be a daunting task. You don’t have to be a math whiz or a data scientist – you’re just asking questions and looking for patterns. If you find something interesting, talk it through with hiring managers and other team members. The data at your fingertips could unlock your team’s next big breakthrough.
To learn more about HireVue’s platform and how you can optimize your recruiting, schedule a demo.


