Candidates: Are you interviewing and need support?
Every year the Talent Board surveys more than 180,000 candidates applying to roles at 200 companies. The resulting research report is the most comprehensive annual study of candidate experience.
Let’s dig into what’s improving, what’s moving in the wrong direction, and other important trends that came out of the report.
What’s Improving?
There’s a lot that’s getting better for the average candidate.
1) More Companies are Surveying Candidates About the Experience
When it comes to how candidates are surveyed, things are looking up. Below you can see how 2017 stacks up to 2016:
| Where candidates are surveyed in the hiring process: | 2017 | 2016 |
| Before the application | 1.6% | 1.5% |
| After the application | 7.1% | 9.1% |
| After the interview | 13.6% | 15.2% |
| After hiring | 26.6% | 23.4% |
| All of the Above | 9.8% | 7.1% |
| Candidates are not surveyed | 41.3% | 43.7% |
With a couple exceptions, we see small increases across the board. (Likely what happened here is companies who were exclusively surveying candidates after the application or interview moved into the “All of the Above” bracket.)
While these aren’t massive shifts, they do show a trend in the right direction.
2) Mobile Apply is Everywhere
In 2016, the percentage of employers who offered mobile-enabled applications jumped from 67% to 79%. In 2017, it jumped even higher, from 79% to 91%.
| 2017 | 2016 | 2015 | |
| Percent of employers offering mobile apply | 91% | 79% | 67% |
This is great for multiple reasons. Smartphones are the sole source of internet access for many people, and preferred by most. With 91% of employers offering mobile apply, it’s practically universal.
3) Pre-Hire Assessments on the Upswing
As a screening tool, traditional pre-employment assessments can be a mixed bag. On one hand, they provide a scientific measurement of a candidates’ aptitude and relevant traits. On the other, they tend to prolong the hiring process and cause higher than normal rates of dropout (most assessments consist of 60+ closed-ended questions).
89% of all employers had assessments and testing systems in place, up from 81% in 2017. Oddly enough, the percentage of employers using each type of assessment went down across the board:
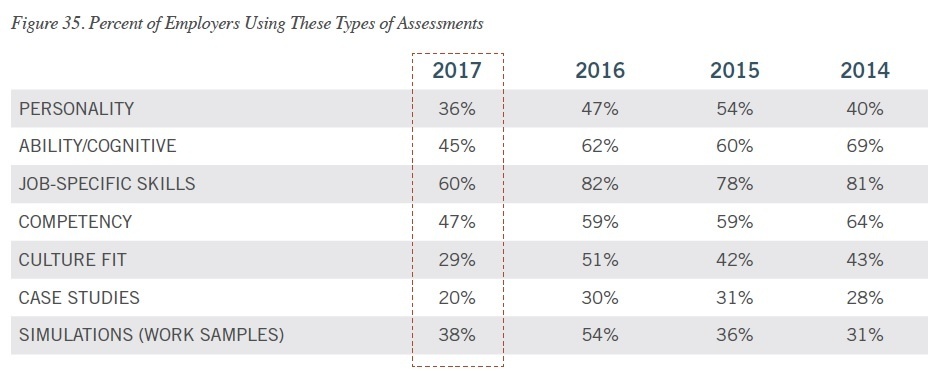
This probably means that while employers are more likely to use a pre-hire assessment, they are less likely to use them in conjunction with others (moving to a single test vs. a battery of tests). Since additional assessments usually add time to the hiring process, this sort of consolidation is generally good for candidates.
What’s Moving in the Wrong Direction?
There are also some areas for improvement.
1) Time to Complete the Application
While the Talent Board didn’t break down application time the same way they have in previous years, we get enough information to see that it’s moving in the wrong direction.
| 2017 | 2016 | |
| Percent of applicants who took <15 minutes | 20% | 26% |
In 2016, 26% of candidates reported that their application took 15 minutes or less. In 2017, that number dropped to 20%. The labor market is tight. Most candidates in a tight labor market are already employed; a long application is an easy way to lose their interest.
2) Feedback for Applicants is Declining
On the whole, feedback sent by a recruiter is being replaced with automated messages. Here you can see the difference between 2016 and 2017: 2016:
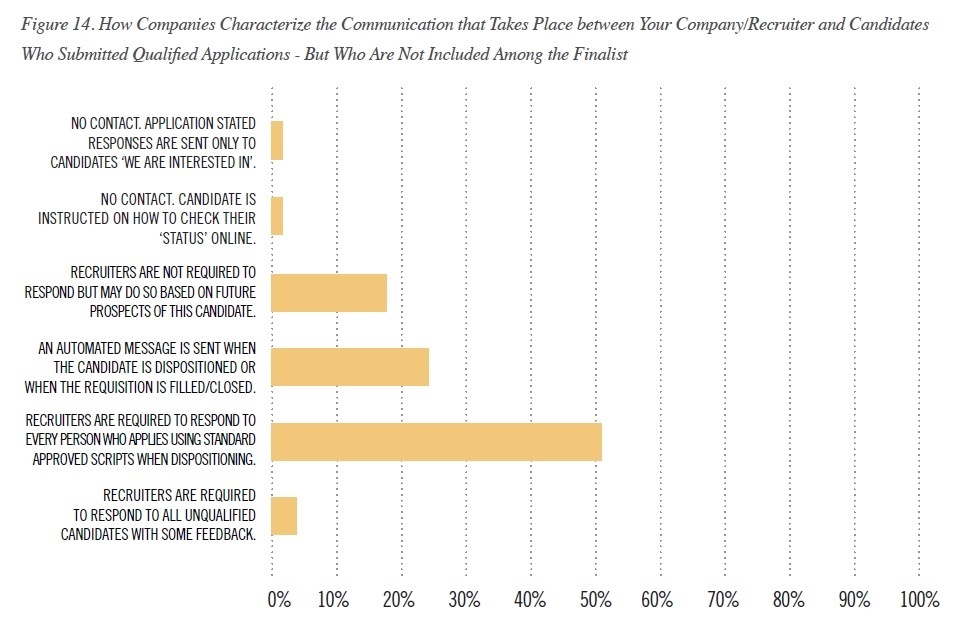
2017: 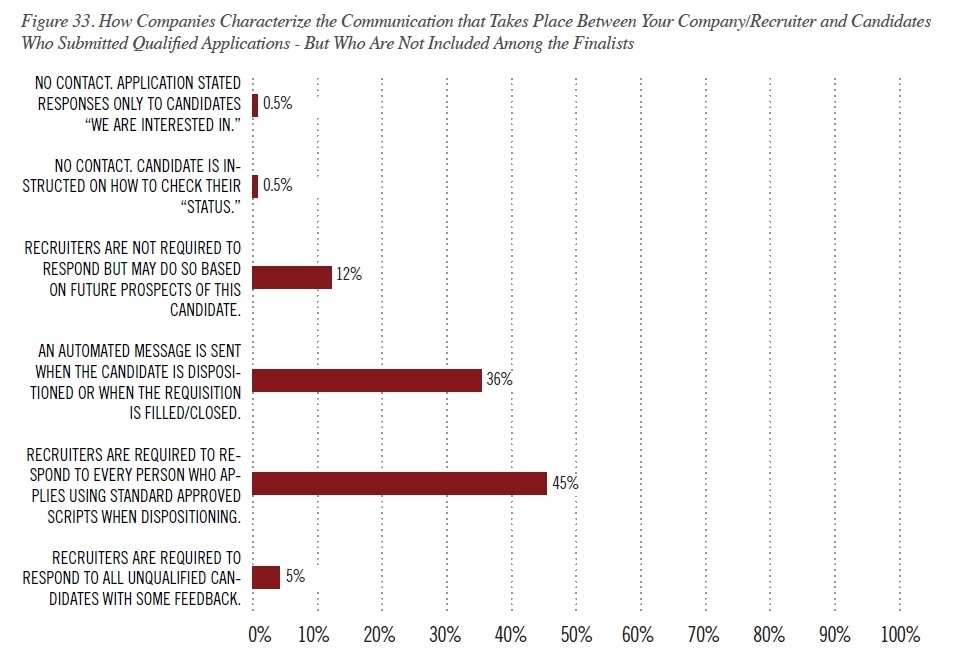 This isn’t really surprising - automation plays an important role in making hiring more efficient. It also looks like a percentage of organizations who did not require contact shifted into the "automation" category - this shift is a good thing. But the “human touch” is a prime opportunity to give candidates a great experience, especially when it involves sensitive situations like dispositioning. You can’t hire every candidate, but you should make every effort to ease the pain of rejection. A solid trade-off might be to ask candidates for feedback, even if you’re using automated messaging. 85% of candidates who gave their experience the lowest rating received no opportunity to provide feedback.
Other Important Trends
The candidate's experience doesn't just impact their perception of your brand.
1) Candidate Experience Has a Huge Impact on Referrals & Repeat Applications
Below you can see the difference between candidates who rated their overall experience one star (the lowest) and five stars (the highest). 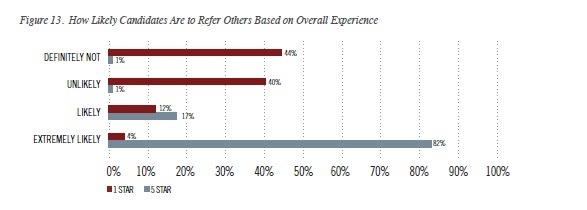 What’s surprising is the massive impact a great experience has on referrals. 82% is huge. That’s nearly every candidate phoning a friend to recommend your open roles. Of course, the experience also has an impact on whether they’ll apply to your organization again:
 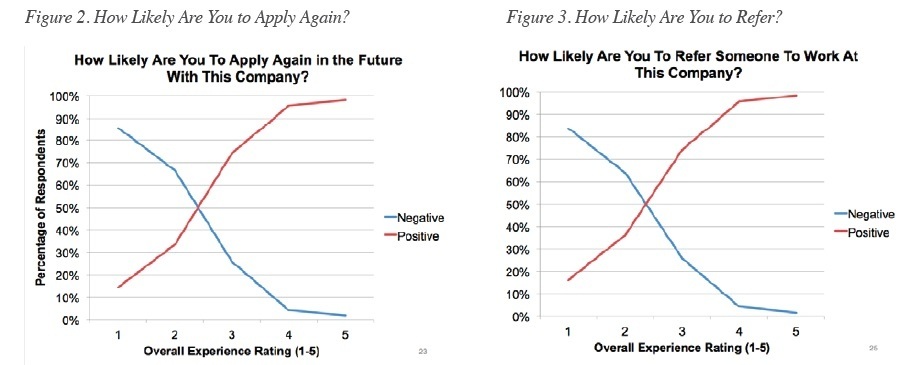 Intuitively, this makes sense. Candidates don’t want to put their close friends and colleagues through a bad experience. If they did, it wouldn’t just reflect poorly on the employer; it would reflect poorly on them too.
2) A Bad Experience Makes Candidates Withdraw from the Recruiting Process
Of the candidates who gave their experience the lowest possible score and withdrew from the recruiting process, 46% said it was because their time was disrespected during interviews. 26% said it was because the process took too long. 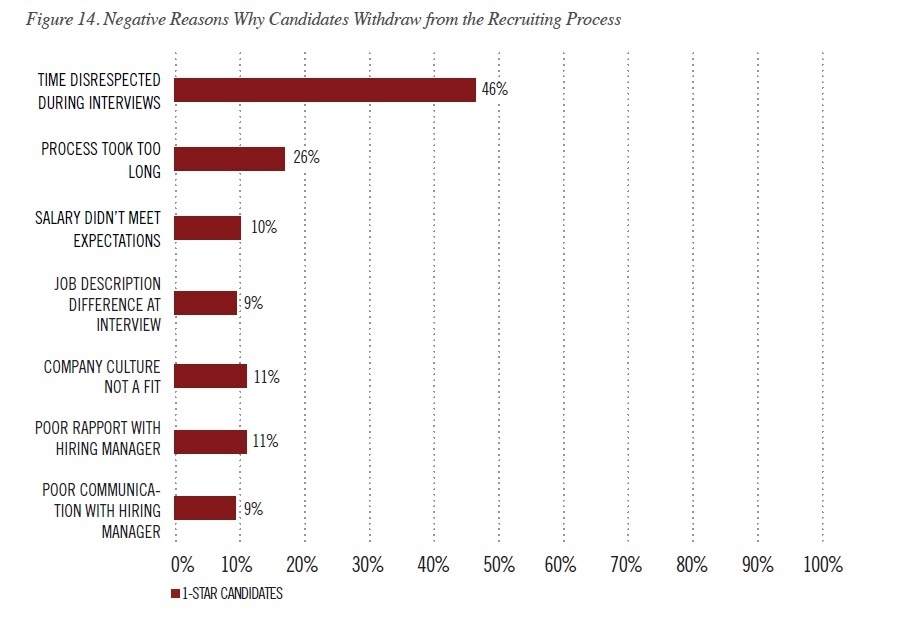 The Talent Board also points out that of candidates who gave their experience the highest rating and still withdrew from the process, only 1.4% left because they felt their time was disrespected. It’s interesting here that a negative candidate experience has more of an impact on the choice to withdraw than something like salary, though this could be because they’re withdrawing earlier in the process.
3) Candidate Experience is Still a Business Driver
In 2016, 64% of candidates who rated their experience five stars out of five said they would increase their business relationship with the employer. 41% of those who rated their experience one star out of five indicated that they would sever it. 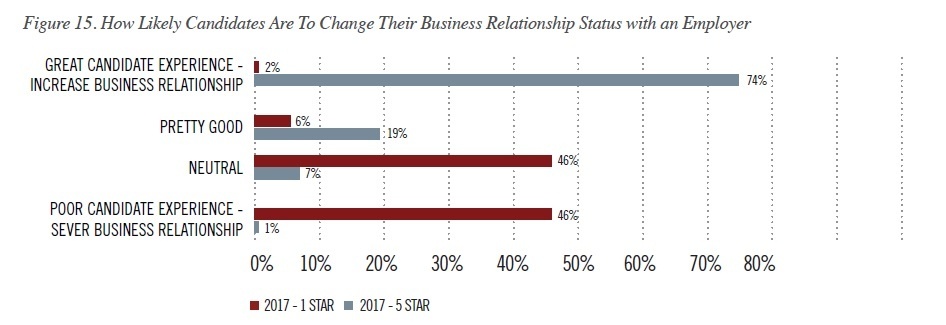 In 2017, we can see both of those numbers go up, with the most noticable increase (a 10% bump) for candidates who had a great experience.
4) Job Research Continues to Dilute
A company’s career site is traditionally the primary place candidates look for job-related information. This is still true in 2017, but we can see the traffic diffusing across different channels:
| Research Channel | 2017 | 2016 | 2015 | 2014 |
| Company Career Site | 58% | 57% | 64% | 65% |
| Referral (employee, candidate, etc) | 36% | 33% | 19% | 17% |
| LinkedIn Career Page | 34% | 30% | 30% | 27% |
| Job Notification | 28% | 28% | 35% | 34% |
| Online Groups (LinkedIn, Slack, etc) | 24% | 24% | 26% | 24% |
| Review Sites (Glassdoor, etc) | 29% | 23% | 24% | 20% |
| Mobile Career Site or App | 26% | 14% | 13% | 11% |
| Professional Associations | 15% | 12% | N/A | N/A |
This isn’t good or bad, per se - but it does mean TA leaders should spread their focus beyond the careers site.


